Kendaks R&D guide

Real-Time Monitoring & Incident Command Center (Azure Monitor + Grafana)

Category: Operations

Scenario: NOC needs a single pane of glass for services, SLAs, and incidents. Example: 'Kendaks Command Center' uses dashboards, alerts, and war-room workflows.

Architecture diagram

High-level view of the main components and data/control flows.

Architecture diagram

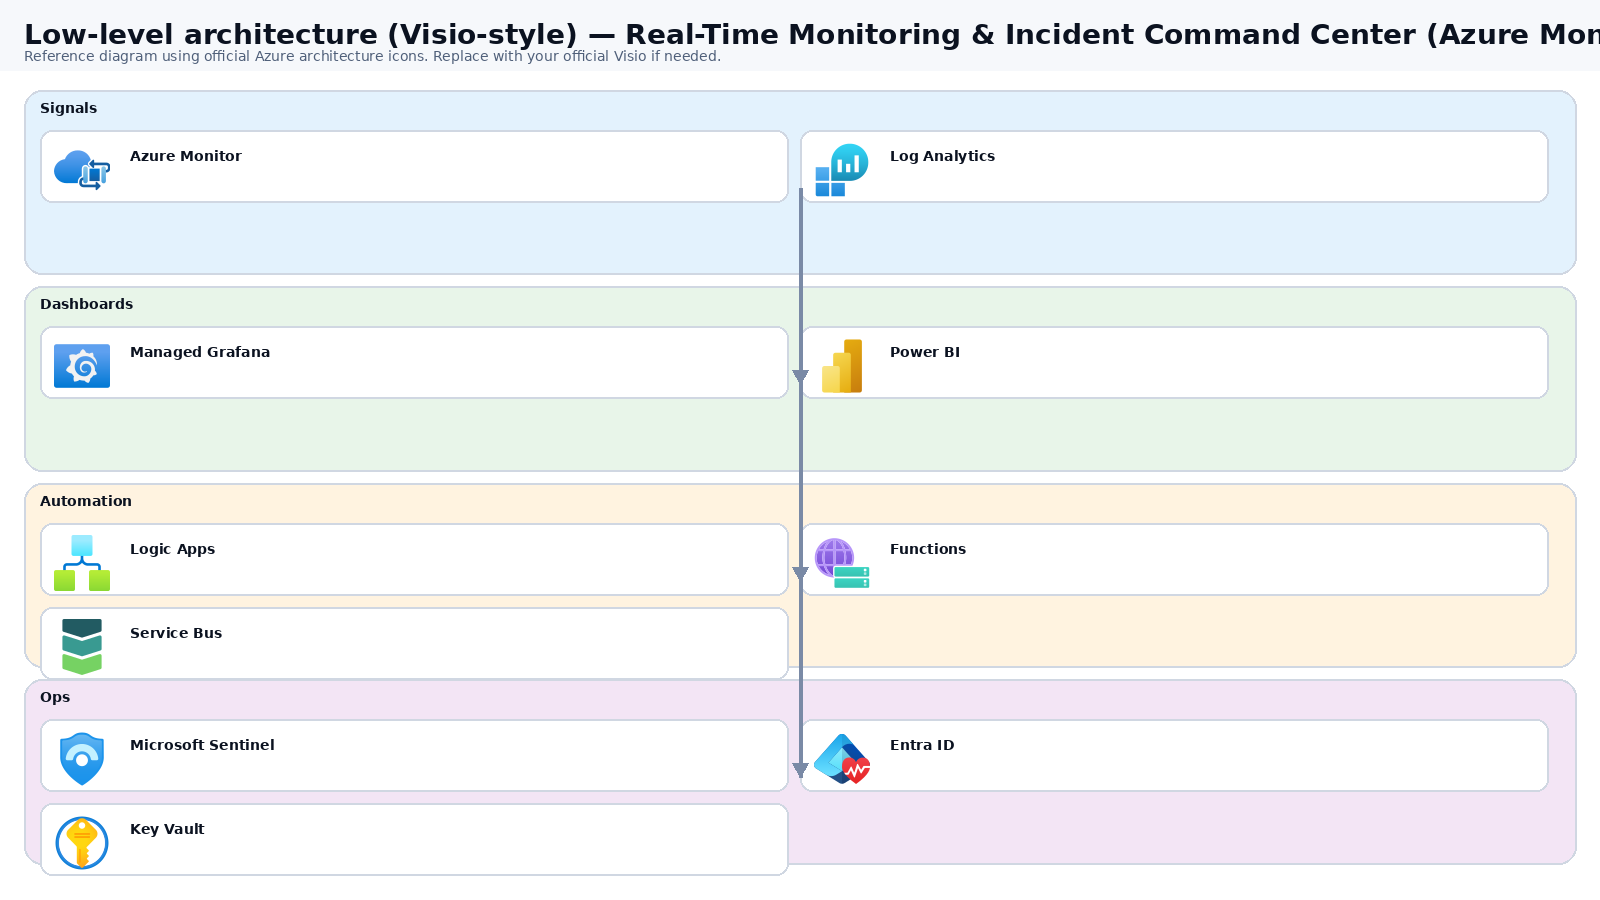
Low-level architecture diagram (Visio-style)

Implementation view (networking, security, ops). Click to open full size.

Low-level architecture diagram

Low-level architecture details

(No low-level text provided.)

Step-by-step implementation

Step 1/6
Plan

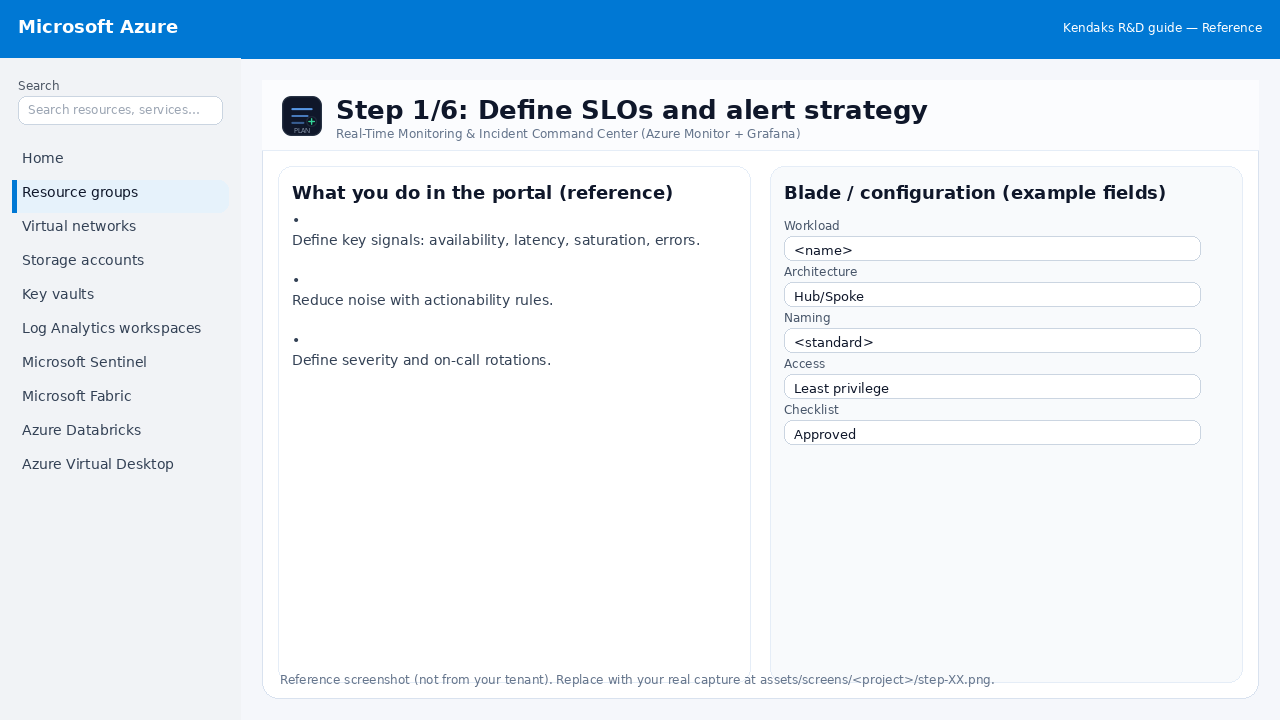
Define SLOs and alert strategy

Reference screenshot for Real-Time Monitoring & Incident Command Center (Azure Monitor + Grafana) step 1
Reference portal screenshot (click to zoom). Replace with your tenant capture if needed.
  • Define key signals: availability, latency, saturation, errors.
  • Reduce noise with actionability rules.
  • Define severity and on-call rotations.
Validation checklist
  • Stakeholders have signed off the scope, SLAs, and data/security requirements.
  • You have documented naming standards, environments, and ownership (RACI).
Zoomed screenshot
Step 2/6
Deploy

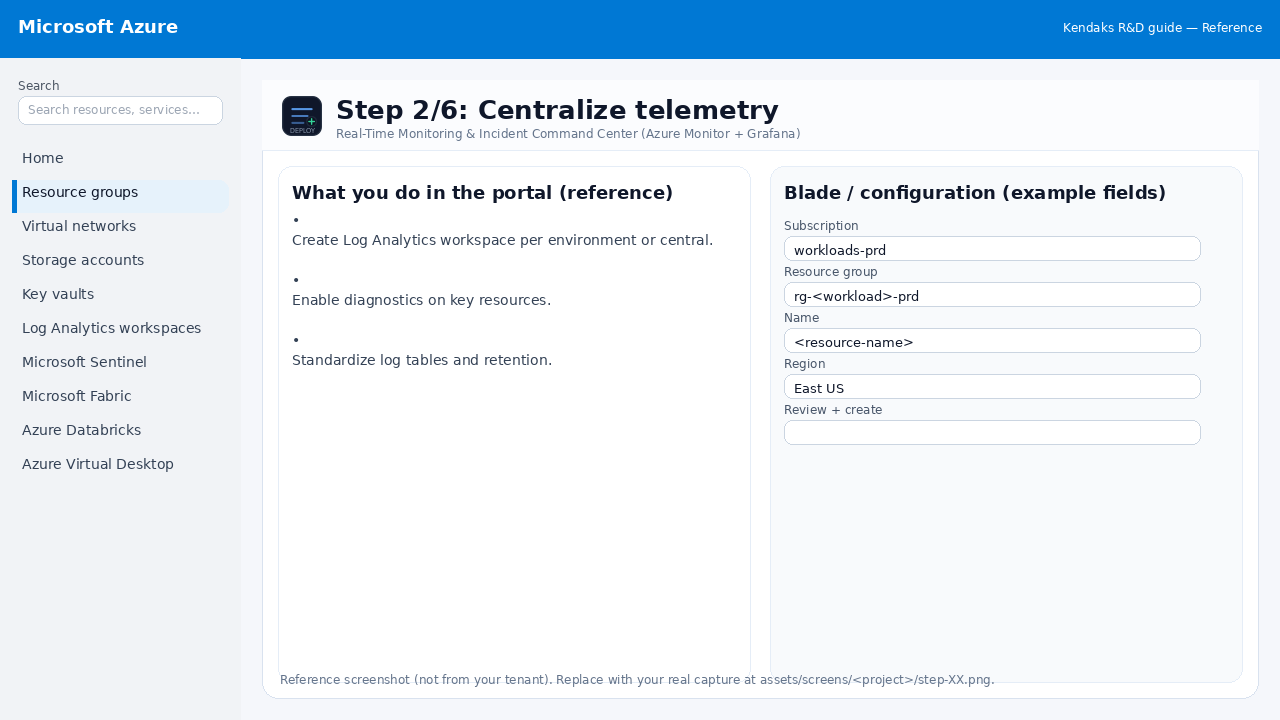
Centralize telemetry

Reference screenshot for Real-Time Monitoring & Incident Command Center (Azure Monitor + Grafana) step 2
Reference portal screenshot (click to zoom). Replace with your tenant capture if needed.
  • Create Log Analytics workspace per environment or central.
  • Enable diagnostics on key resources.
  • Standardize log tables and retention.
Validation checklist
  • Deployment completed; smoke tests passed; rollback plan confirmed.
Zoomed screenshot
Step 3/6
Monitor

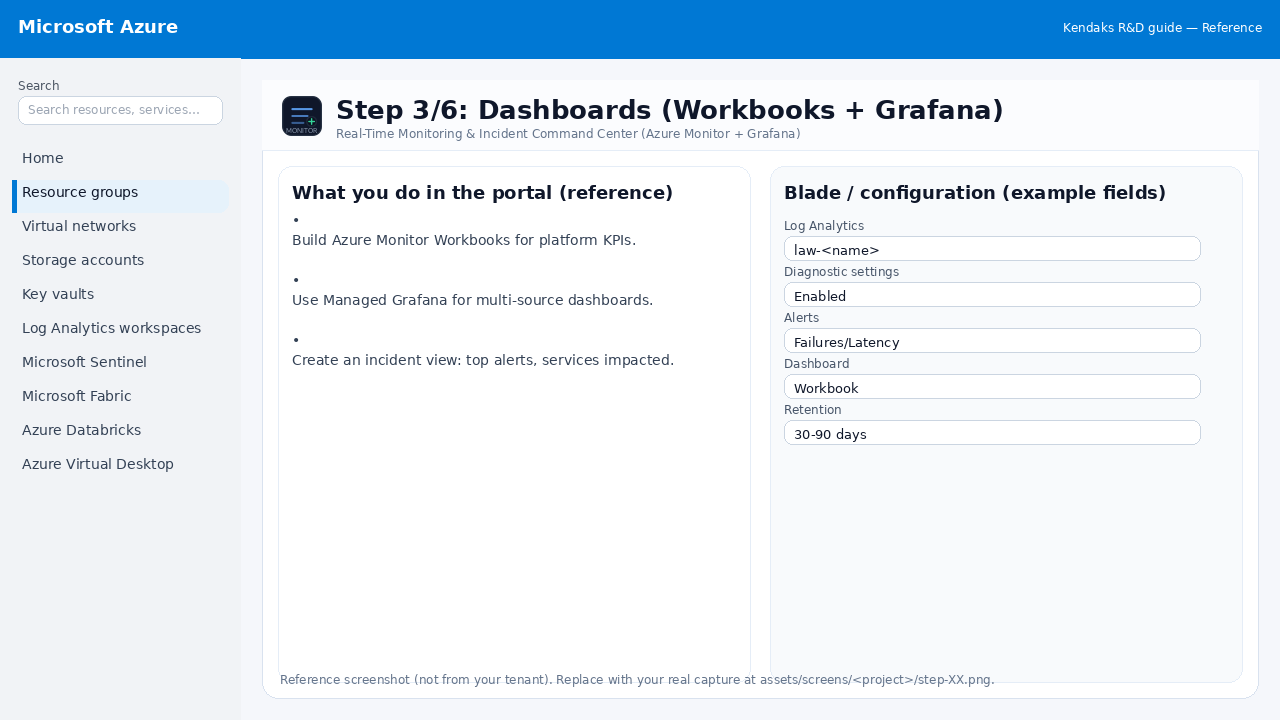
Dashboards (Workbooks + Grafana)

Reference screenshot for Real-Time Monitoring & Incident Command Center (Azure Monitor + Grafana) step 3
Reference portal screenshot (click to zoom). Replace with your tenant capture if needed.
  • Build Azure Monitor Workbooks for platform KPIs.
  • Use Managed Grafana for multi-source dashboards.
  • Create an incident view: top alerts, services impacted.
Validation checklist
  • Logs and metrics are flowing (check Log Analytics / Monitor).
  • Alerts trigger correctly (test alert path to email/Teams/ITSM).
Zoomed screenshot
Step 4/6
Integrate

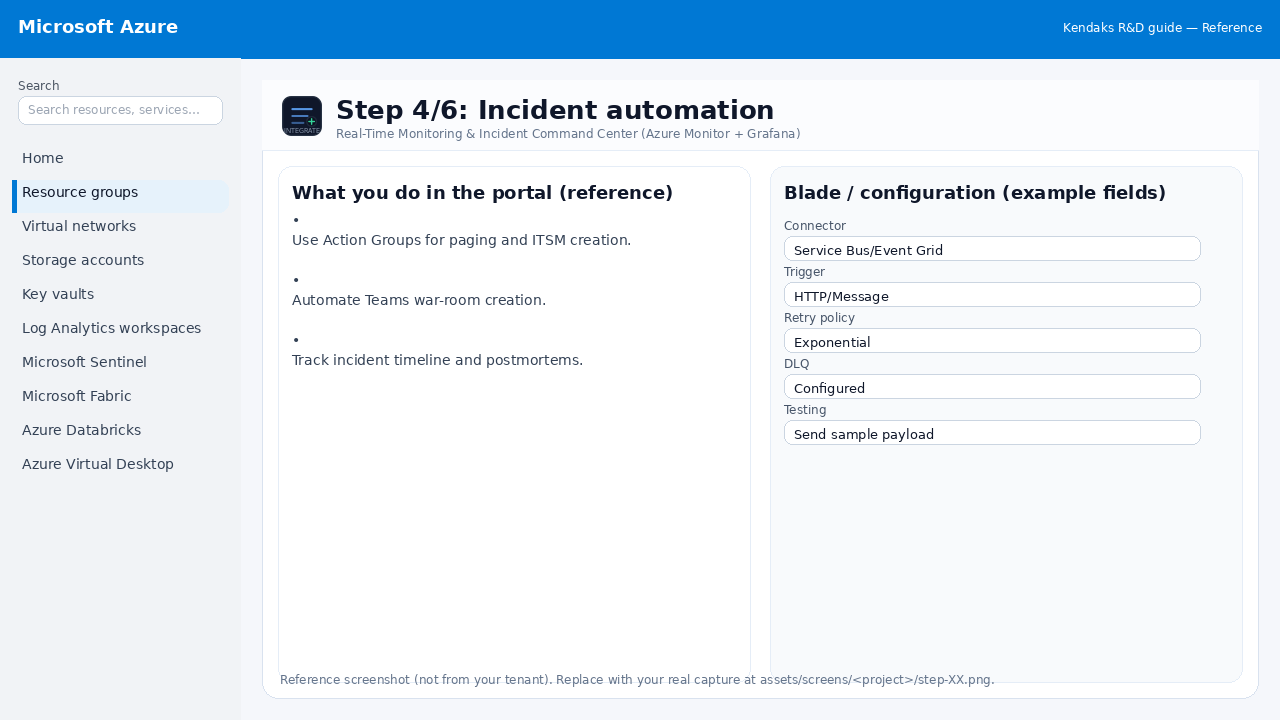
Incident automation

Reference screenshot for Real-Time Monitoring & Incident Command Center (Azure Monitor + Grafana) step 4
Reference portal screenshot (click to zoom). Replace with your tenant capture if needed.
  • Use Action Groups for paging and ITSM creation.
  • Automate Teams war-room creation.
  • Track incident timeline and postmortems.
Validation checklist
  • Connections/authentication succeed and test messages/records flow through.
  • Retries/DLQ/error handling are configured and validated with a forced failure.
Zoomed screenshot
Step 5/6
Secure

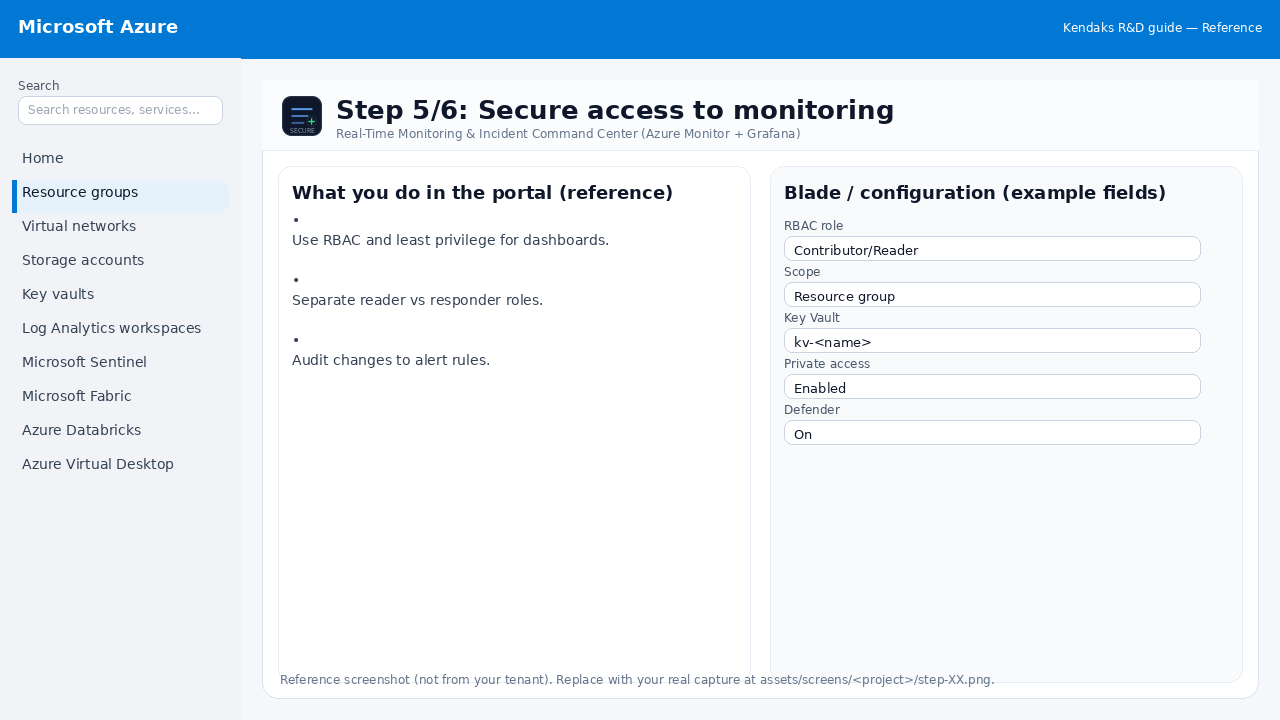
Secure access to monitoring

Reference screenshot for Real-Time Monitoring & Incident Command Center (Azure Monitor + Grafana) step 5
Reference portal screenshot (click to zoom). Replace with your tenant capture if needed.
  • Use RBAC and least privilege for dashboards.
  • Separate reader vs responder roles.
  • Audit changes to alert rules.
Validation checklist
  • Security baseline applied (Defender/Policy/WAF/Firewall rules as applicable).
  • No public endpoints unless explicitly approved; private endpoints verified where applicable.
  • Alerts are configured for high-risk events.
Zoomed screenshot
Step 6/6
Test

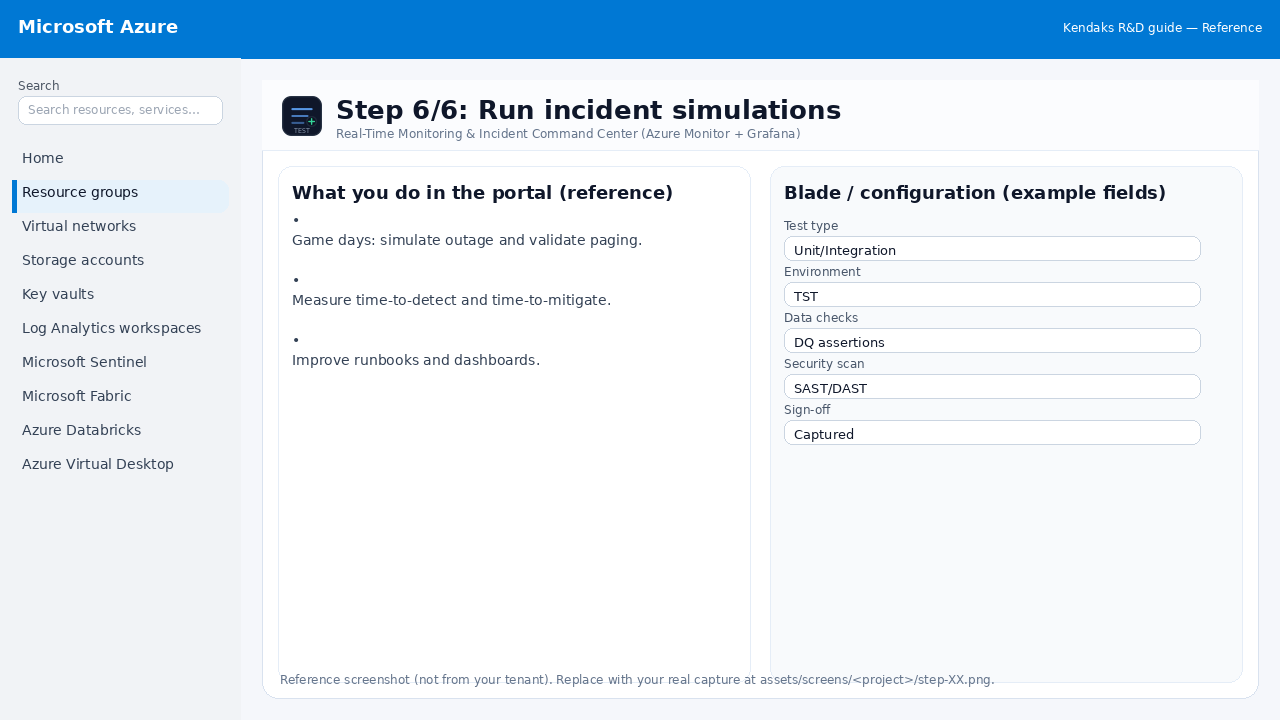
Run incident simulations

Reference screenshot for Real-Time Monitoring & Incident Command Center (Azure Monitor + Grafana) step 6
Reference portal screenshot (click to zoom). Replace with your tenant capture if needed.
  • Game days: simulate outage and validate paging.
  • Measure time-to-detect and time-to-mitigate.
  • Improve runbooks and dashboards.
Validation checklist
  • UAT completed with representative users and scenarios.
  • Performance meets baseline; issues tracked and remediated.
Zoomed screenshot

Video tutorials

References